I like docker, it's easy and is mainly used today. We'll need (a lot of) containers to achieve a nice level of monitoring and we'll use docker-compose to improve multi-service orchestration.
I'll assume you have some basic knowledge about docker, unix commands, your NAS and of course a terminal.
We'll need different component:
- Traefik V2 our favorite reverse proxy
- Traefik forward auth for nice authentication of all services (optional)
- Grafana for displaying our metrics
- Prometheus for storing and querying metrics
- Alertmanager for alerting (optional)
- Cadvisor for resource analysing
- Node Exporter for exposing some metrics from the host to Prometheus (optional)
We'll also deploy SSL with Let's Encrypt and use Cloudflare as DNS and anti-ddos solution.
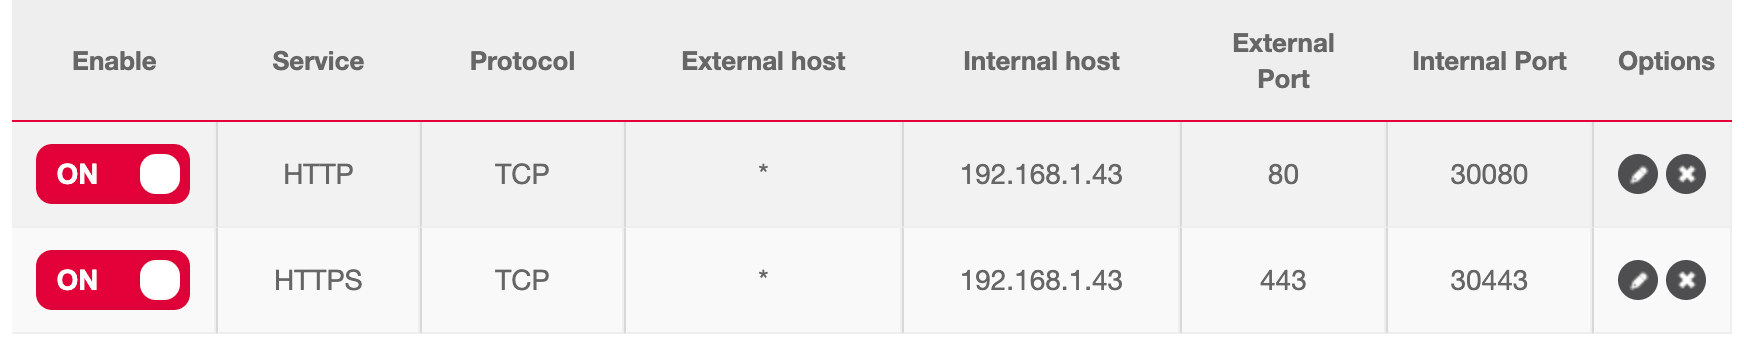
First thing to do is to open port 80 and 443 on your internet router and forward the traffic to the port 30080 and 30443 that will be used by Traefik.
Next important thing to is to add DNS record for your domain to go on your NAS. You can add multiple A record or a wildcard like *.mydomain.com pointing to your internet router public IP.
Next step is to connect to docker and start our docker-compose declaration.
My NAS is a Qnap, I'll use Container Station and follow instructions on how to connect to docker.
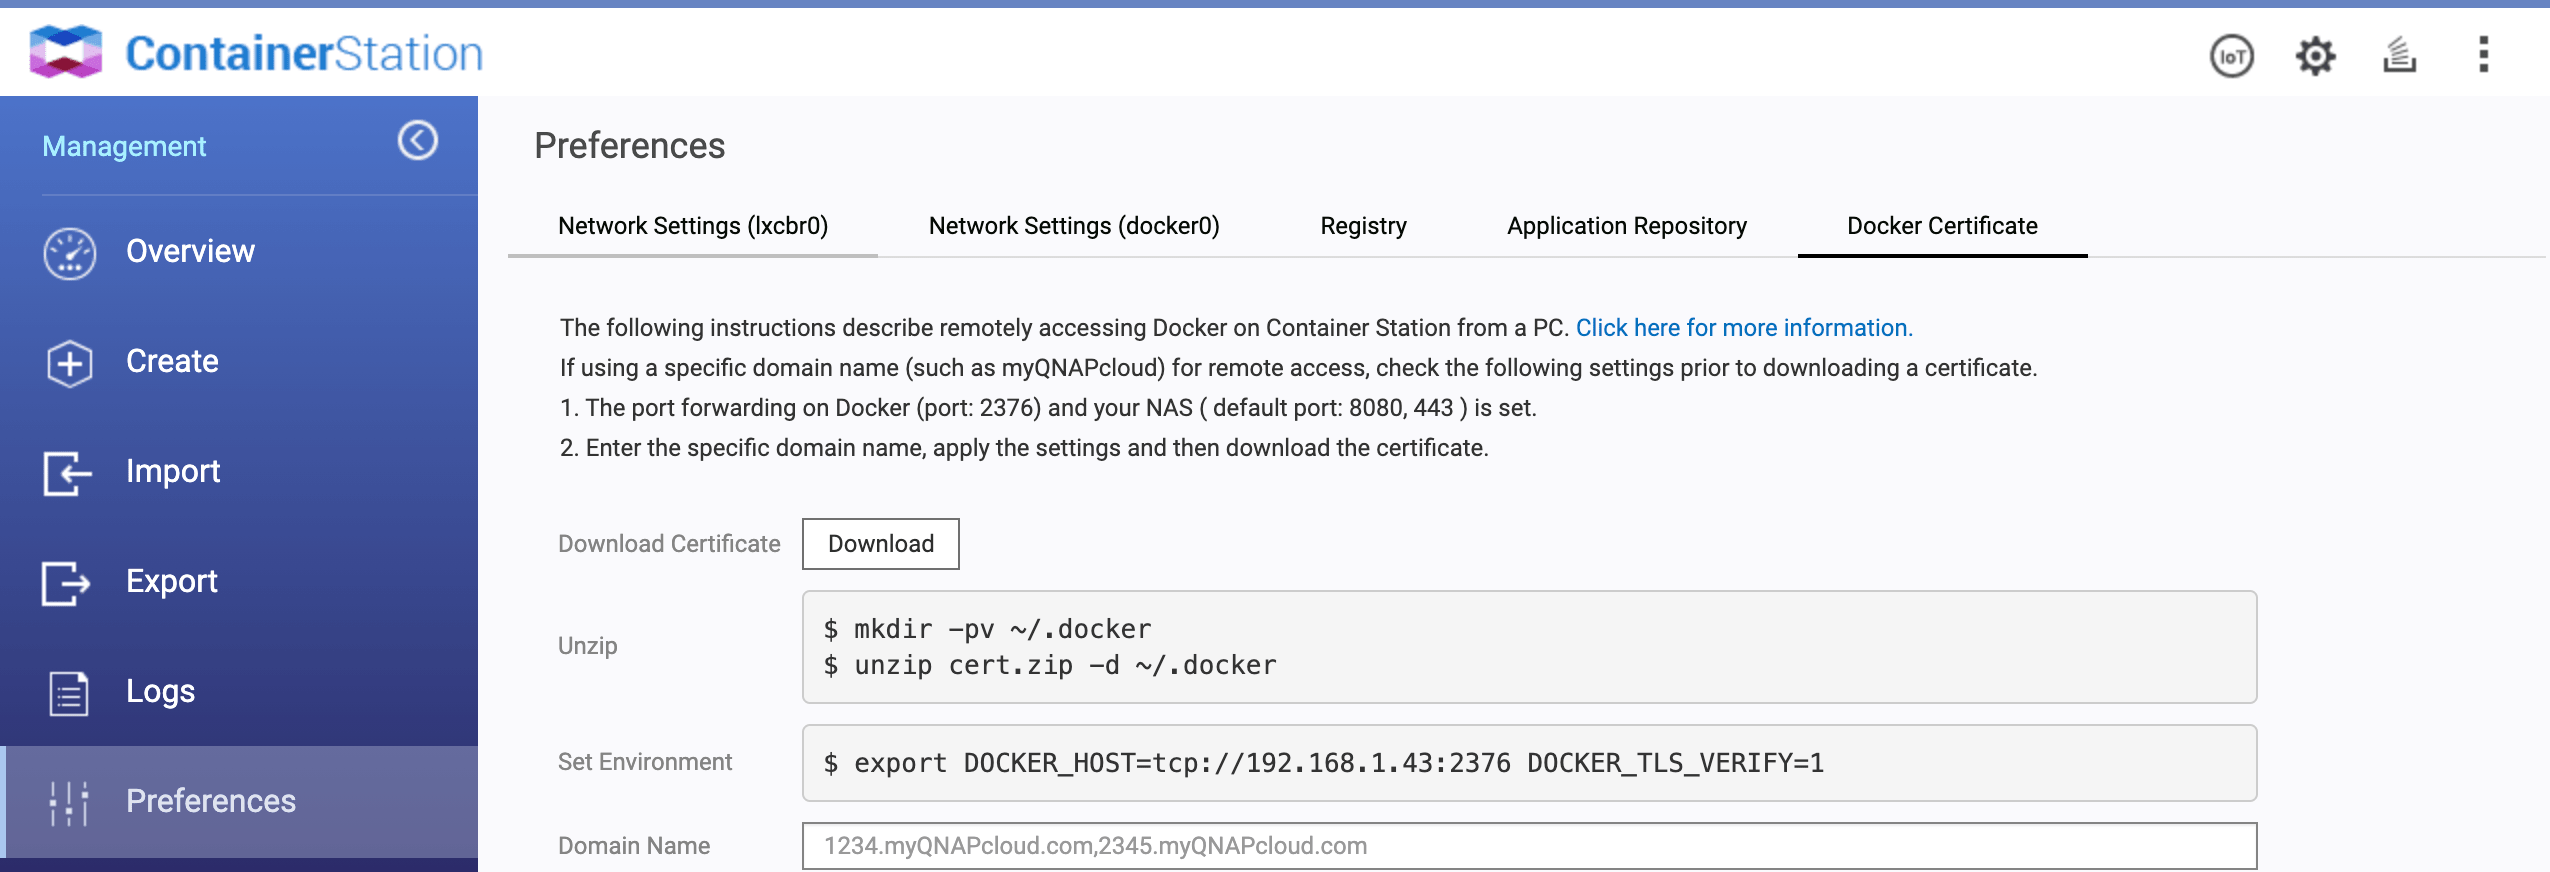
Follow instructions to remotely access Container Station docker on your host. Then execute the following in a terminal.
export DOCKER_HOST=tcp://192.168.1.43:2376 DOCKER_TLS_VERIFY=1
You should now be able to do a docker ps command and see that you are connected to the docker on your NAS.
We'll now start to write our docker-compose with Traefik.
Enable the dashboard, the Docker provider, http and https entrypoints, metrics, access log and SSL generation with Let's Encrypt.
version: "3.4"

services:
  traefik:
    image: traefik:v2.3.2
    container_name: traefik
    command:
    - "--api.insecure=true"
    - "--providers.docker=true"
    - "--providers.docker.exposedbydefault=false"
    - "--entrypoints.http.address=:80"
    - "--entrypoints.https.address=:443"
    - --metrics=true
    - --metrics.prometheus=true
    - --accesslog=true
    - --certificatesresolvers.myresolver.acme.email=postmaster@mydomain.com
    - --certificatesresolvers.myresolver.acme.storage=/acme.json
    - --certificatesresolvers.myresolver.acme.caserver=https://acme-v02.api.letsencrypt.org/directory
    - --certificatesresolvers.myresolver.acme.dnschallenge=true
    - --certificatesresolvers.myresolver.acme.dnschallenge.delaybeforecheck=0
    - --certificatesresolvers.myresolver.acme.dnschallenge.provider=cloudflare
    - --certificatesresolvers.myresolver.acme.dnschallenge.resolvers[0]=1.1.1.1:53
    - --certificatesresolvers.myresolver.acme.dnschallenge.resolvers[1]=8.8.8.8:53
    environment:
    - [email protected]
    - CLOUDFLARE_API_KEY=mysecretapikey
    ports:
    - "30080:80"
    - "30443:443"
    - "38080:8080"
    volumes:
    - /var/run/docker.sock:/var/run/docker.sock:ro
    - /share/docker/traefik/acme.json:/acme.json
    restart: on-failure
As you can see, we'll use the DNS challenge method because our NAS is hidden between Cloudflare and Let's Encrypt cannot ensure certificate using TLS challenge.
We'll need to fetch the Cloudflare API Key (the global one) from our account. Traefik will use those credentials to add DNS record for the certificate generation.
We also need to store the generated SSL certificates (to avoid unnecessary reissued) by mounting a volume. Volumes will also be needed by other containers. I choose to create a folder /share/docker on the NAS to store all those volumes.
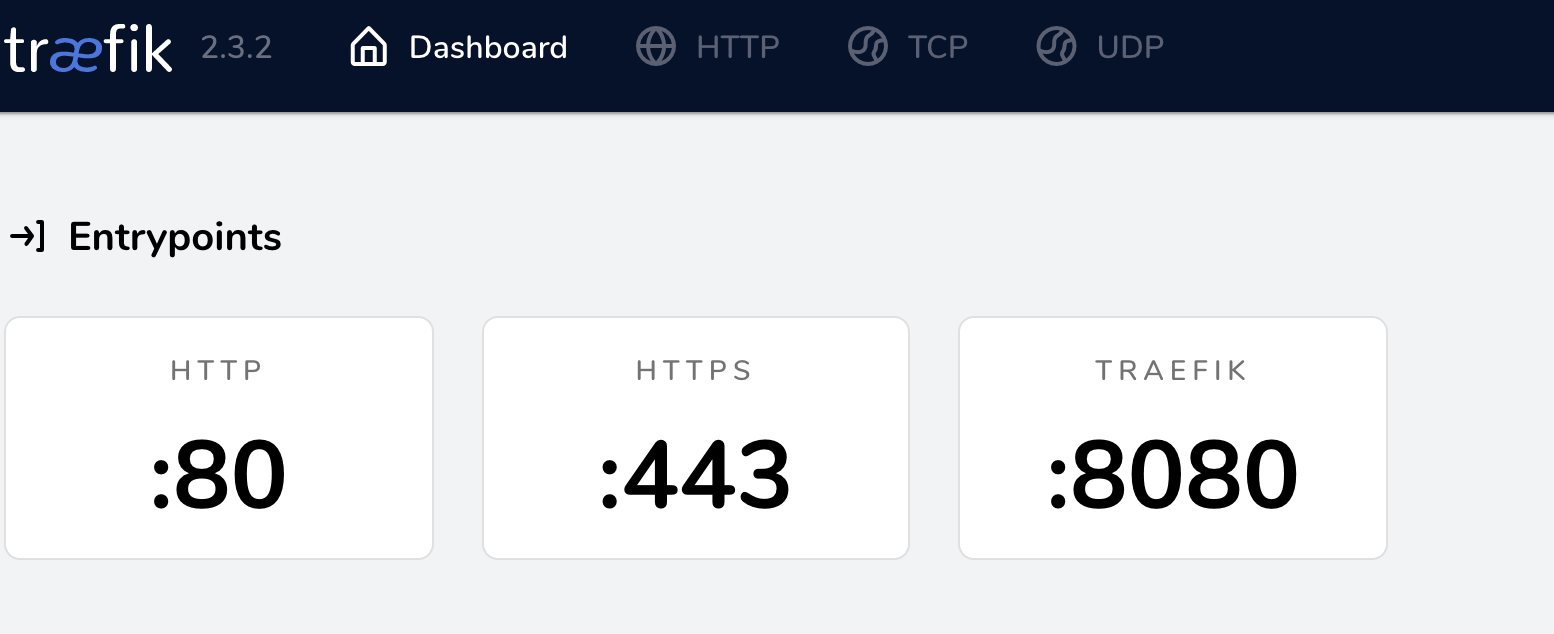
You can now run the containers docker-compose up -d and access to your Traefik dashboard at http://YOUR_NAS_IP:38080
Next step is to add Traefik forward auth to add or replace services login system. Grafana for example is using his own login system by default. Prometheus do not have any login system and his accessible by default. To avoid different credentials between services (or no credentials at all!) we'll use Traefik forward auth to use Google OAuth2 system. We'll be able to login using our Google account for everything.
You can follow those instructions to create Google developer application https://github.com/thomseddon/traefik-forward-auth#google
You can already setup allowed redirect URI https://grafana.mydomain.com/_oauth https://prometheus.mydomain.com/_oauth and https://alertmanager.curvur.ch/_oauth
I restricted the provider to only one user (myself) by setting the WHITELIST env var.
version: "3.4"

services:
  traefik:
  ...
  traefik-forward-auth:
    image: thomseddon/traefik-forward-auth:2
    container_name: traefik-forward-auth
    environment:
    - PROVIDERS_GOOGLE_CLIENT_ID=****
    - PROVIDERS_GOOGLE_CLIENT_SECRET=****
    - SECRET=generateRandomSecret
    - WHITELIST=***@gmail.com
    - COOKIE_DOMAIN=mydomain.com
    labels:
    - "traefik.enable=true"
    - "traefik.http.middlewares.traefik-forward-auth.forwardauth.address=http://traefik-forward-auth:4181"
    - "traefik.http.middlewares.traefik-forward-auth.forwardauth.authResponseHeaders=X-Forwarded-User"
    - "traefik.http.services.traefik-forward-auth.loadbalancer.server.port=4181"
Next step is to add Prometheus and Grafana to store and display metrics.
version: "3.4"

services:
  traefik:
  ...
  traefik-forward-auth:
  ...
  grafana:
    image: grafana/grafana:7.2.2
    container_name: grafana
    environment:
      - GF_METRICS_ENABLED=true
      - GF_AUTH_ANONYMOUS_ENABLED=true
      - GF_AUTH_ANONYMOUS_ORG_ROLE=Admin
      - GF_AUTH_BASIC_ENABLED=false
      - GF_AUTH_DISABLE_LOGIN_FORM=true
      - GF_INSTALL_PLUGINS=grafana-piechart-panel
    labels:
      - "traefik.enable=true"
      - "traefik.http.routers.grafana.rule=Host(`grafana.mydomain.com`)"
      - "traefik.http.routers.grafana.entrypoints=http,https"
      - "traefik.http.routers.grafana.middlewares=traefik-forward-auth"
      - traefik.http.routers.grafana.tls=true
      - traefik.http.routers.grafana.tls.certresolver=myresolver
    volumes:
        - /share/docker/grafana:/var/lib/grafana
    restart: on-failure

  prometheus:
    image: prom/prometheus:v2.22.0
    container_name: prometheus
    command:
      - "--config.file=/etc/prometheus/prometheus.yml"
      - "--storage.tsdb.path=/prometheus"
      - --storage.tsdb.retention.time=30d
      - "--web.console.libraries=/usr/share/prometheus/console_libraries"
      - "--web.console.templates=/usr/share/prometheus/consoles"
    labels:
      - "traefik.enable=true"
      - "traefik.http.routers.prometheus.rule=Host(`prometheus.mydomain.com`)"
      - "traefik.http.routers.prometheus.entrypoints=http,https"
      - "traefik.http.routers.prometheus.middlewares=traefik-forward-auth"
      - traefik.http.routers.prometheus.tls=true
      - traefik.http.routers.prometheus.tls.certresolver=myresolver
    volumes:
        - /share/docker/prometheus/datas:/prometheus
        - /share/docker/prometheus/prometheus.yml:/etc/prometheus/prometheus.yml
        - /share/docker/prometheus/rules:/etc/prometheus/rules
    restart: on-failure
For Grafana we enabled metrics and anonymous login (because it'll be restricted and protected by our OAuth2 proxy). Added one plugin, and a volume to have persistance on data.
We added TLS to both services so Traefik will ask to Let's Encrypt generate certificate for them and added the traefik-forward-auth middleware to restrict services with Google login.
Prometheus will have 30 days of retention and we added a volume to store data on the NAS (and not lose them if the container restart).
At this point you can docker-compose up -d and try to access Grafana or Prometheus: https://grafana.mydomain.com should redirect you to Google login page. Then after login you should be on your Grafana dashboard!
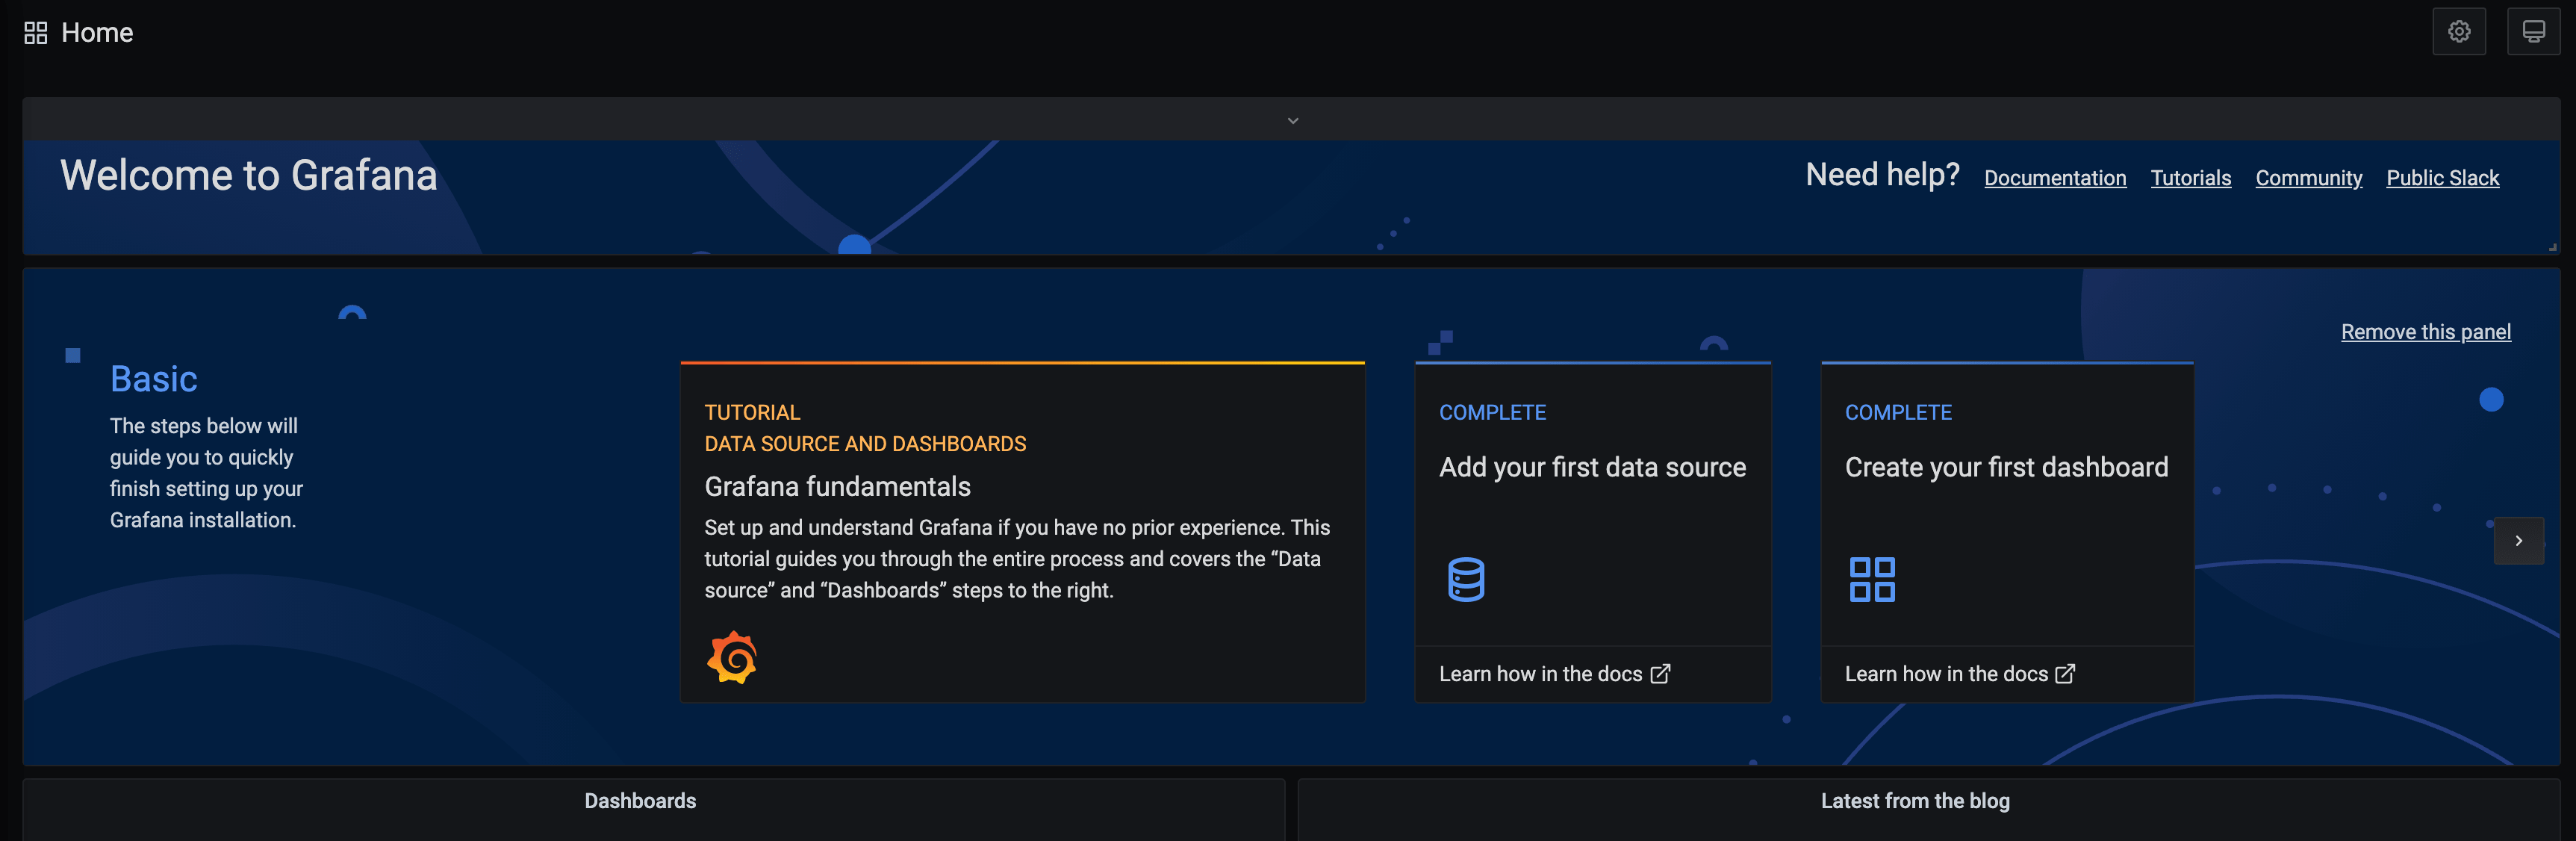
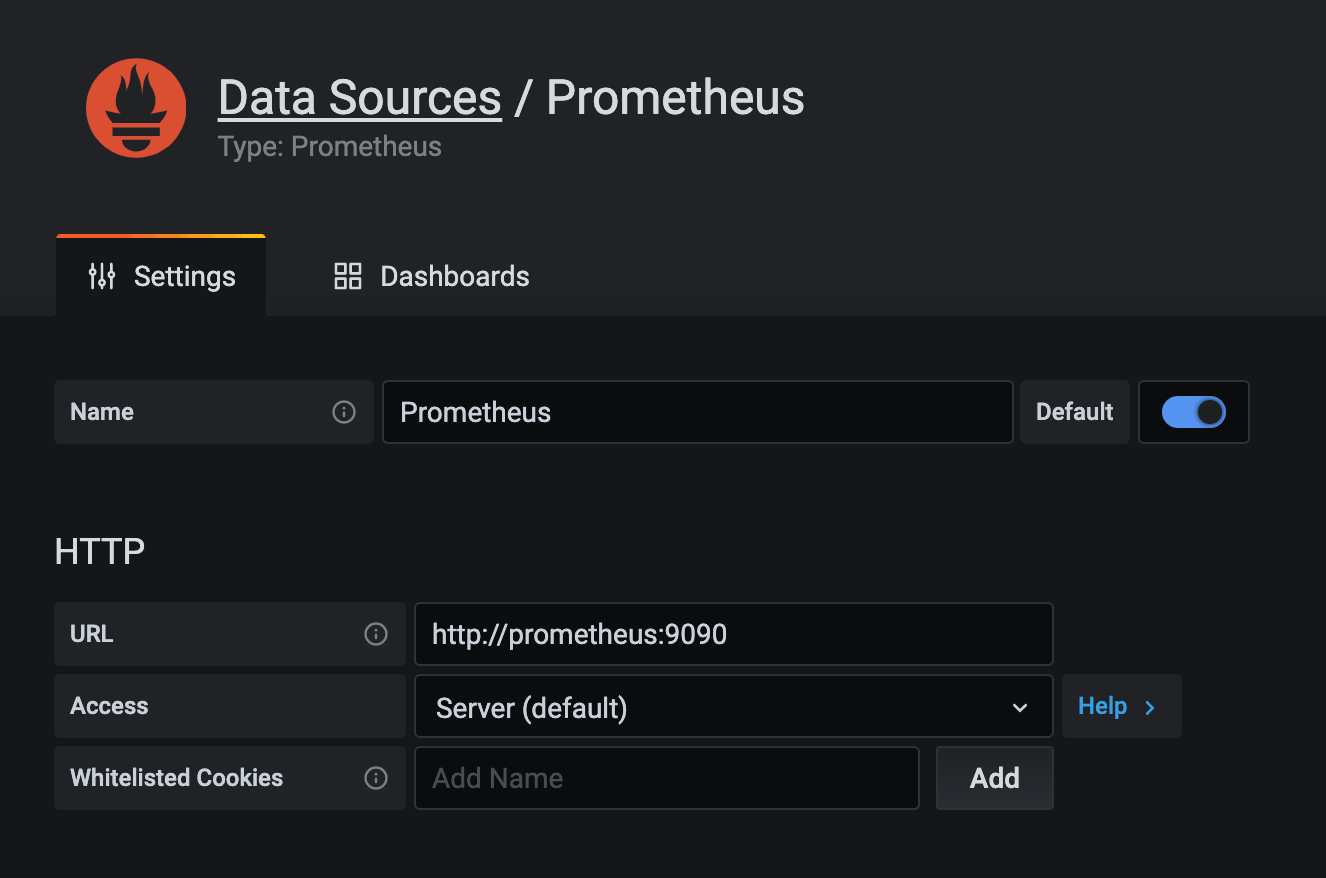
Add the Prometheus as the main data sources.
Final containers to setup is Alertmanager, Cadvisor and node exporter.
version: "3.4"

services:
  traefik:
  ...
  traefik-forward-auth:
  ...
  grafana:
  ...
  node_exporter:
    image: prom/node-exporter:v1.0.1
    container_name: node-exporter
    restart: on-failure

  alertmanager:
    image: prom/alertmanager:v0.21.0
    container_name: alertmanager
    labels:
      - "traefik.enable=true"
      - "traefik.http.routers.alertmanager.rule=Host(`alertmanager.mydomain.com`)"
      - "traefik.http.routers.alertmanager.entrypoints=http,https"
      - "traefik.http.routers.alertmanager.middlewares=traefik-forward-auth"
      - traefik.http.routers.alertmanager.tls=true
      - traefik.http.routers.alertmanager.tls.certresolver=myresolver
    restart: on-failure

  cadvisor:
    image: gcr.io/google-containers/cadvisor:v0.36.0
    container_name: cadvisor
    volumes:
    - /:/rootfs:ro
    - /var/run:/var/run:rw
    - /sys:/sys:ro
    - /var/lib/docker/:/var/lib/docker:ro
    restart: on-failure
Again, nothing fancy, no persistant storage is needed and only Alertmanager will be exposed to internet.
Start those containers with docker-compose up -d and check that you can connect to your Alertmanager instance.
Final step is to configure Prometheus to scrape metrics and create Grafana dashboard.
The content of the Prometheus config file (/share/docker/prometheus/prometheus.yml) to be created on your NAS and that'll be mounted on the container.
global:
  scrape_interval: 15s
  scrape_timeout: 10s
  evaluation_interval: 15s
alerting:
  alertmanagers:
  - scheme: http
    timeout: 10s
    api_version: v1
    static_configs:
    - targets:
      - alertmanager:9093
rule_files:
- /etc/prometheus/rules/*.yaml
scrape_configs:
- job_name: prometheus
  honor_timestamps: true
  scrape_interval: 15s
  scrape_timeout: 10s
  metrics_path: /metrics
  scheme: http
  static_configs:
  - targets:
    - localhost:9090
- job_name: grafana
  honor_timestamps: true
  scrape_interval: 15s
  scrape_timeout: 10s
  metrics_path: /metrics
  scheme: http
  static_configs:
  - targets:
    - grafana:3000
- job_name: node_exporter
  honor_timestamps: true
  scrape_interval: 15s
  scrape_timeout: 10s
  metrics_path: /metrics
  scheme: http
  static_configs:
  - targets:
    - node_exporter:9100
- job_name: traefik
  honor_timestamps: true
  scrape_interval: 15s
  scrape_timeout: 10s
  metrics_path: /metrics
  scheme: http
  static_configs:
  - targets:
    - traefik:8080
- job_name: cadvisor
  honor_timestamps: true
  scrape_interval: 15s
  scrape_timeout: 10s
  metrics_path: /metrics
  scheme: http
  static_configs:
  - targets:
    - cadvisor:8080
- job_name: alertmanager
  honor_timestamps: true
  scrape_interval: 15s
  scrape_timeout: 10s
  metrics_path: /metrics
  scheme: http
  static_configs:
  - targets:
    - alertmanager:9093
You can also create alerting rules for Traefik for example (/share/docker/prometheus/rules/traefik.yaml)

Prometheus will then evaluate those rules and warn the alertmanager if needed. You can then configure alertmanager to be warned by email, slack or other way that something wrong is happening. This is not documented on this blog post, but do not hesitate to comment bellow if you want to see that in action. I also have other rules that I didn't share here but do not hesitate to ask too.
For Grafana, you can find awesome dashboard on internet but I'll share you one that I find perfect for Docker monitoring.
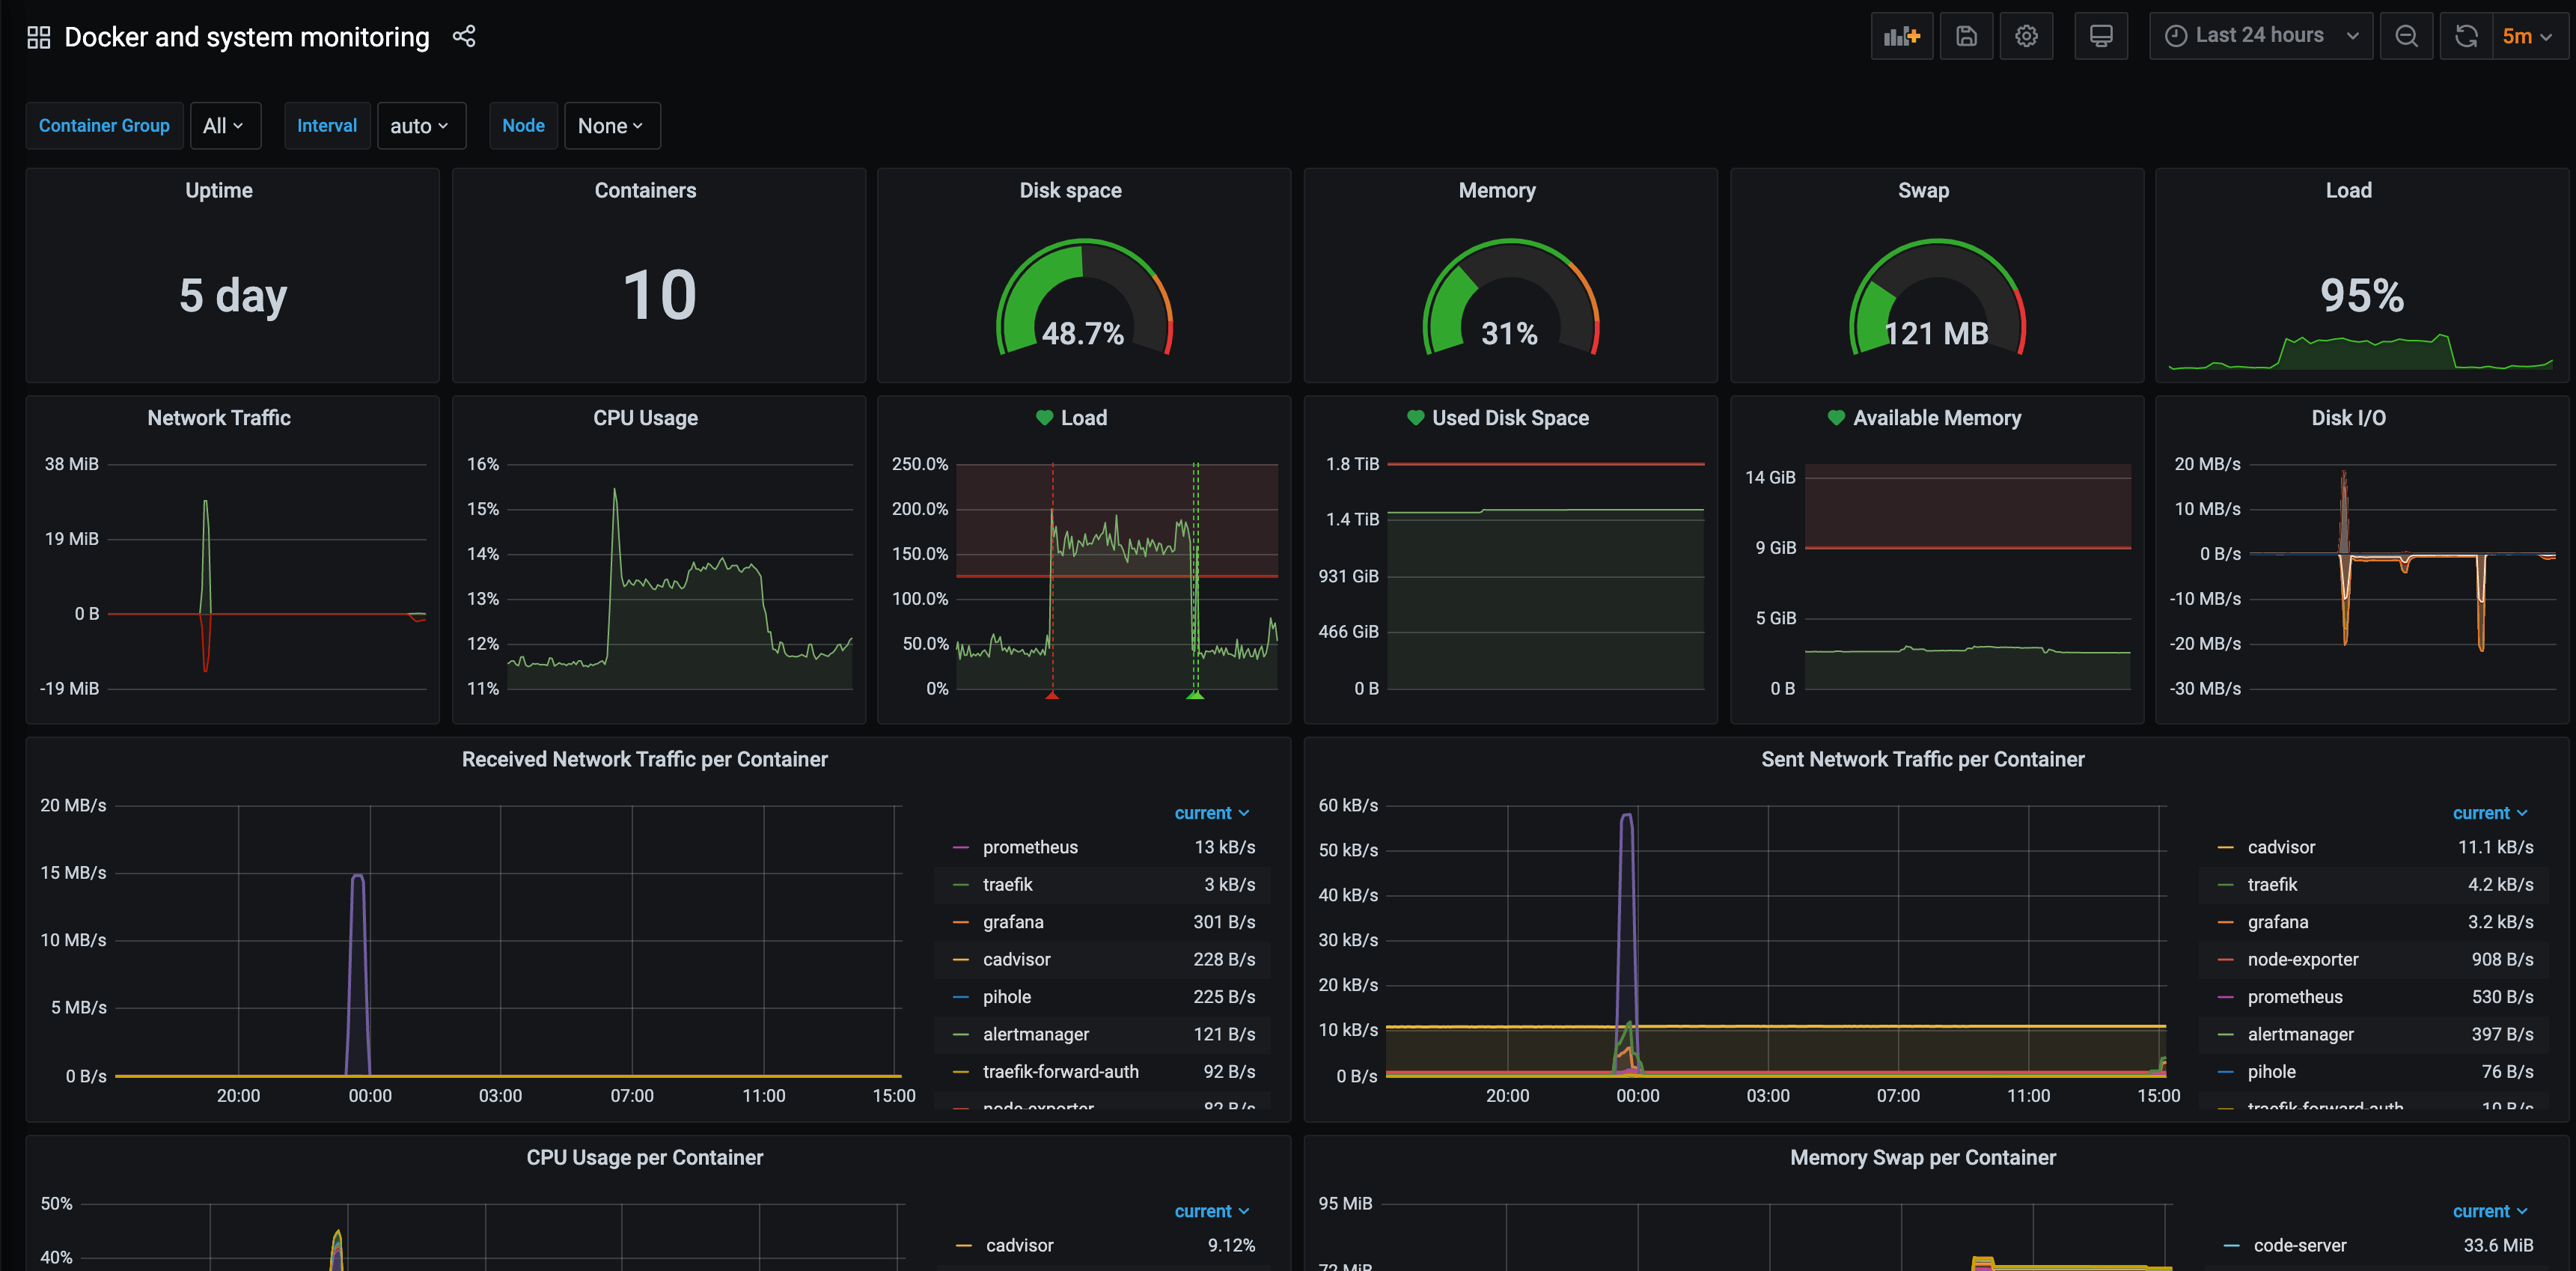
Final docker-compose is available here.
As always it was written in a rush, do not hesitate to comment if I forget something, if you need more informations, or more dashboards and rules.
This blog post can help you to have a good monitoring stack but also a nice docker-compose stack with TLS to add more services if needed.