What's the goal? Trace network between multiple services. Imagine you have an application that's behind Traefik and this application talks to other services like a webservice.
It could be hard to trace the network between the user, the proxy and your tons of services talking together.
For this demo we'll using docker-compose for fast (and furious) deployment.
We have our user using a browser, a proxy (Traefik 2.x), an PHP application and a webservice in Python. The goal is to track the routing between all this services.
Our traefik configuration looks like this with tracing enabled.
[ping]
[providers]
    [providers.docker]
        constraints = "Label(`traefik.tags`,`web`)"
[tracing]
  [tracing.jaeger]
    samplingServerURL = "http://jaeger-agent:5778/sampling"
    localAgentHostPort = "jaeger-agent:6831"
[log]
  level = "DEBUG"

[entryPoints]
  [entryPoints.web]
    address = ":80"
We'll use Jaeger from Uber as our Distributed Tracing Platform.
Using this example https://github.com/jaegertracing/jaeger/blob/master/docker-compose/jaeger-docker-compose.yml we will setup the agent, the UI and the Casandra database.
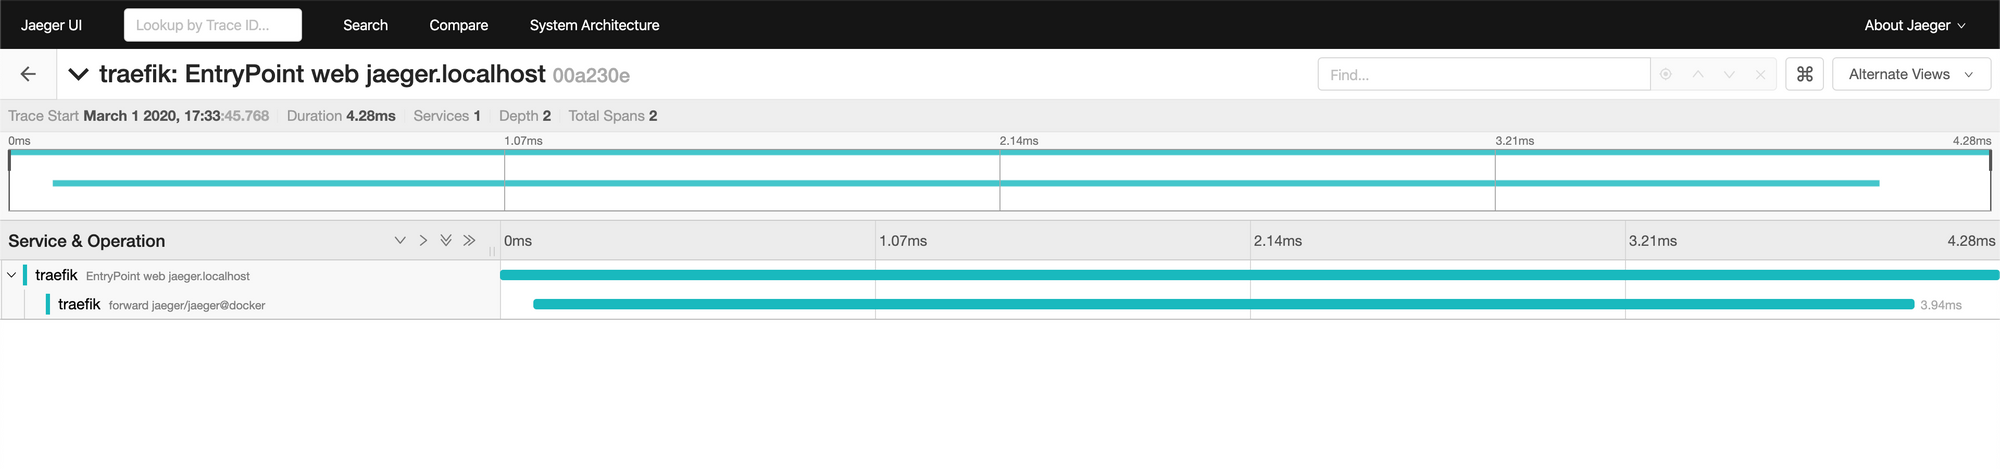
From here we can already track Traefik calls.
Next step is to track our network from Traefik to the PHP application.
We'll add dependencies to our composer.json file.
"jukylin/jaeger-php": "^2.0",
"opentracing/opentracing":"1.0.0-beta5",
In our PHP controller we'll instantiate our Jaeger tracer.
$config = Config::getInstance();
$tracer = $config->initTracer('php-application', 'jaeger-agent:6831');
$spanContext = $tracer->extract(Formats\TEXT_MAP, getallheaders());
$span = $tracer->startSpan(__FUNCTION__, ['child_of' => $spanContext]);
...
// my calls to our Python API without forgetting to forward Uber-Trace-Id header
$headers = getallheaders();

$request = new \GuzzleHttp\Psr7\Request(
	'POST',
    'http://python-application.localhost',
    [
    	'Content-Type' => 'application/json',
        'Uber-Trace-Id' => $headers['Uber-Trace-Id']
    ]
);
...
$span->finish();
$config->flush();
From there in the Jaeger dashboard when you are calling your PHP application you should see the network going from Traefik to your PHP application.
Last step is to include the Python traffic to this trace.
Adding jaeger-client to your dependencies (requirements.txt). We are using Tornado 6 for the exemple.
jaeger-clientconfig = Config(
config={
'sampler': {
'type': 'const',
'param': 1,
},
'logging': True,
'local_agent': {'reporting_host': 'jaeger-agent'},
},
service_name='python-application',
validate=True,
scope_manager=AsyncioScopeManager()
)
tracer = config.initialize_tracer()
span_context = tracer.extract(Format.HTTP_HEADERS, self.request.headers)
with tracer.start_span(
operation_name='operation_name',
tags={'HTTP_URL': self.request.full_url(), 'HTTP_METHOD': self.request.method},
child_of=span_context
) as span:
...
# Your code handling the http request
...
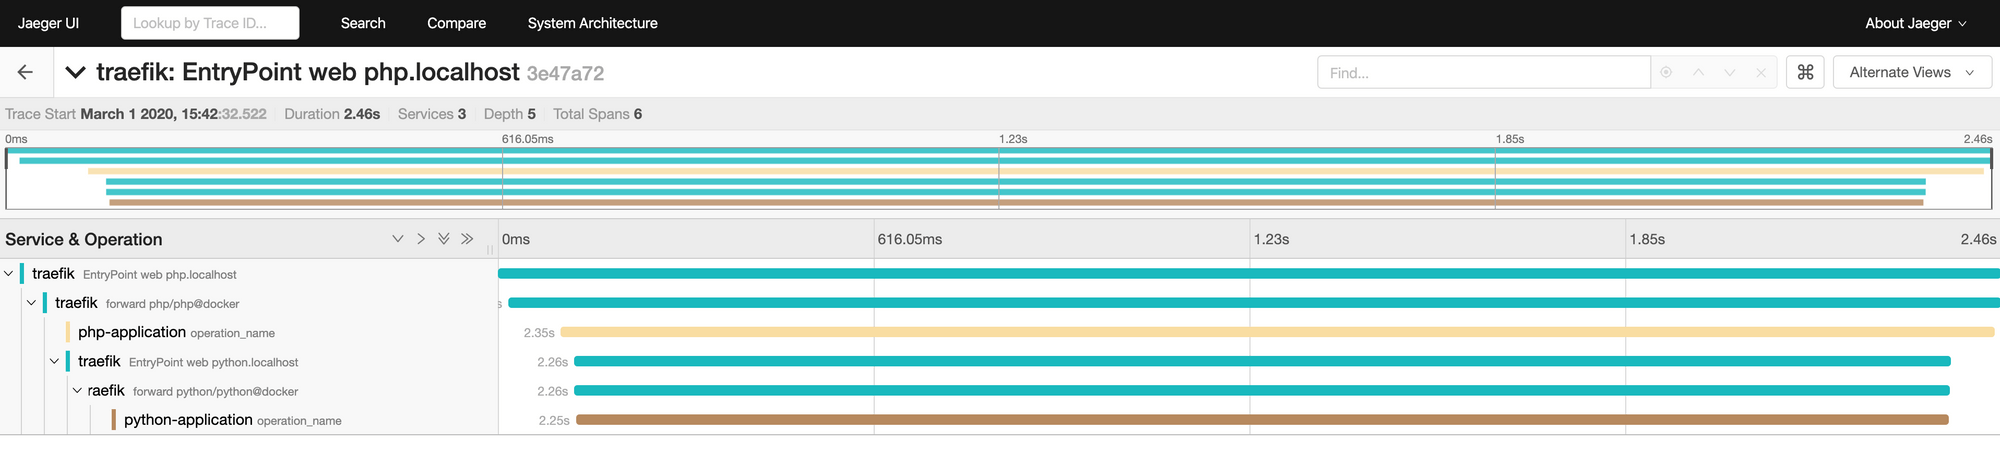
In this screenshot you see that our traffic is going back to Traefik before going to the Python application. It's not necessary.
Disclaimer: blog post written in 10 minutes, some things could miss but the main process is here.